More WSPR developments…
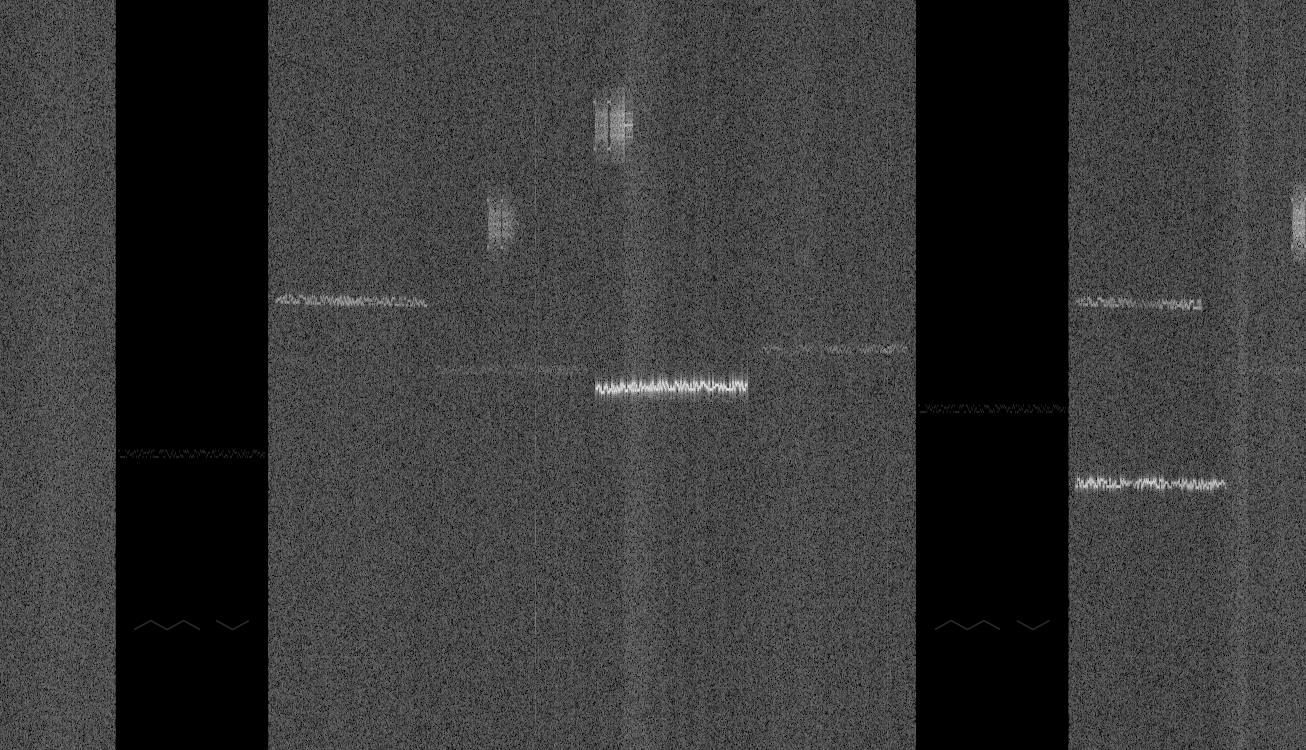
Well, I took a hint from Bruce, W1BW and modified my beacon to do both WSPR and visual beaconing on 30m. Below, you can see the spectrogram of about 16 minutes of recording at my station. The parts with the background nearly black are when my beacon is transmitting. You can see both the WSPR message above and the initial MV below. Each time the WSPR message is sent, it picks a random spot in the 100hz band from 10.140120 to 10.140220 to send in, but the MV remains centered around 10.140030.
Click to see it full size:

This effectively means that I’m only using about half my power for the WSPR traffic, so I probably should rate my transmit power down by 3db.
I recall burning three or four weeks of a sabbatical getting Saccade.com on the air with Wordpress. So much tweaking…