All LEDs are not created equal…
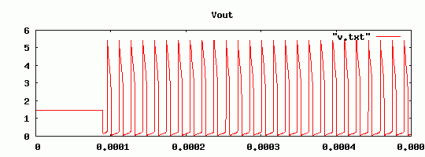
Of course I knew that all LEDs aren’t the same: they differ in color, size and brightness. They also differ in the forward voltage, reverse voltage and capacitance. When I simulated the Joule Thief with LTSpice, I just picked a random LED out of LTSpice’s catalog. When I simulated it, I got a waveform like this:
The voltage peaked over 5 volts, and the frequency was around 64khz.
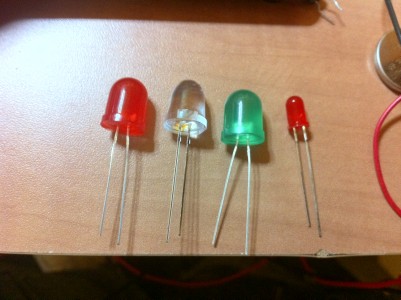
But what does the waveform really look like? I grabbed four LEDs out of my junkbox for testing, found a battery holder so I wouldn’t have to use three hands to get it hooked to my oscilloscope, and shot some pictures. First, the LEDS:
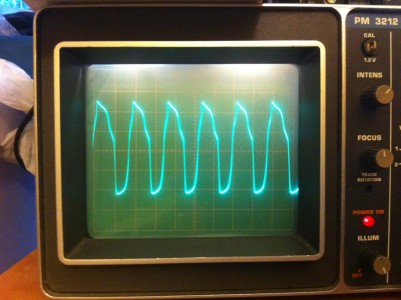
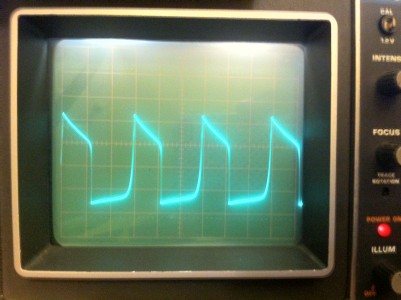
From left to right, they are a generic large red LED which used to be part of a throwie, a high-intensity lensed red LED from Radio Shack, a large green LED from radio shack, and a smaller common red LED from my junk box. I hooked them each up to the joule thief in turn. They all lit up. Here’s the generic red large LED:
The cycle time is a bit faster than I predicted: I estimate it’s oscillating at around 200khz. It’s voltage peaks are also quite a bit smoother and lower than the model I set up in LTSpice. For this picture, the vertical markings are just 0.5 volts, indicating a peak to valley of about 2 volts.
Here’s the larger, high intensity LED:
It’s much closer to a sine wave, and with a much higher peak to valley.
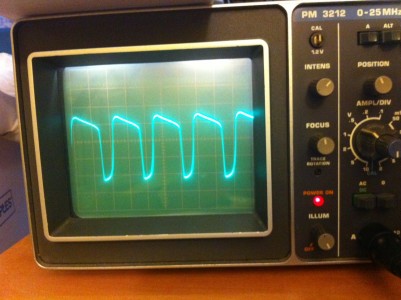
Here’s the green LED:
Much more trapezoidal, but with a catch: the voltage variations were so great I had to change the oscilloscope settings to 1 volt per vertical division.
And finally, here’s a smaller, run of the mill red LED…
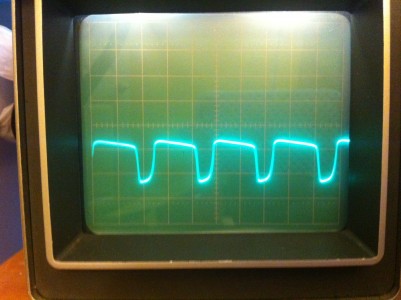
I left it at 0.5 volts per division, so you can see this is much lower.
So, what have I learned from all this? Well, not much at the moment. The green LED seems to match the waveform that I got from simulation most closely, but it’s oscillating at a higher frequency than predicted, and still has a somewhat lower peak to valley voltage range. I’ll probably go back and tinker with the LTSpice model some more (probably by modifying the characteristics of the diode, as well as varying the inductance of the transformer) and see if I can capture the variety of waveforms that I see here.
It was a fun excuse to hook up the scope.
I recall burning three or four weeks of a sabbatical getting Saccade.com on the air with Wordpress. So much tweaking…