New addition to the brainwagon lab: a Rigol DS1102E
This week, I splurged and bought myself a new piece of test equipment: a Rigol DS1102E 100Mhz oscilloscope, and compared to my old 25Mhz Philips (which was indeed a great buy at only $20) it’s very, very cool. Among the most neat features that I’ve started to use is the ability to do screen and waveform grabs, and save them to a little USB flash drive. To gain some experience with the new gadget, I dusted off a version of Hans Summers’ low power QRSS beacon that I had breadboarded up a chunk of copper clad. Here’s the video I did about it (and a glimpse of my old scope too!):
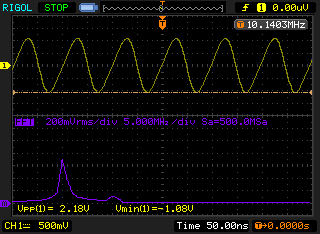
The oscillator operates around 10.14 Mhz, and I couldn’t really see any detail of the waveform with my old scope: it just didn’t have the necessary bandwidth. But with the new scope, the situation is quite a bit different. I powered the oscillator up with a pair of D cell alkalines. I adjusted the bias potentiometer for the best looking sine wave, and it’s not too bad. Here’s a screendump of its best looking sine wave, and the FFT of that signal below. You can see that there is a bit of a second harmonic (due mostly to the asymmetrical waveform) but that it’s overall pretty good. The peak to peak voltage is around 2.18 volts, which is about a 12 mw.

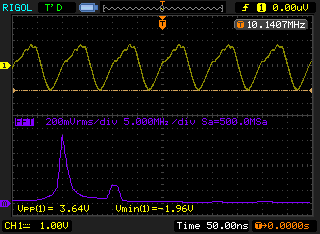
By adjusting the bias potentiometer, you can get more power out: the peak to peak voltage rises to around 3.64V, for an output of around 33mw. But the waveform looks much less uniform, more energy scattered into the second harmonic.

I’m really liking this. I will probably make some additional changes to this circuit tomorrow, but having a good scope to examine how the changes affect the performance is really awesome. A great investment in my electronic education.
I recall burning three or four weeks of a sabbatical getting Saccade.com on the air with Wordpress. So much tweaking…