Extra Stuff: Gambling Ramblings
I picked up a new book on my trip to Reno: Extra Stuff: Gambling Ramblings by Peter Griffin. Griffin is the author of one of my favorite books in my collection of books on gambling topics: The Theory of Blackjack. This book includes all sorts of interesting tidbits of gambling theory.
The book had a particularly interesting and surprising discussion on the Kelly Criterion: a method of wagering that ensures the quickest maximization of bankroll when you have positive expectation in a game. Basically, if you have a probability p > 0.5, you maximize your bankroll when you wager a fraction of your bankroll equal to 2 * p – 1.
Griffin asked an interesting question: what is the probability at any step that you actually have reached the highest bankroll that you’ve ever seen in that step. When the bets are unit sized, you can derive rather simply (and prove via simulation) that the odds are 2 * p – 1 (interestingly, the same fraction used by the Kelly Criterion) that you have reached your peak earnings. But if you try to graph the resulting curve when you use proportional Kelly style bets, you get a function which is not only fairly complicated, but is in fact discontinuous. This seemed very unintuitive to me, so I wrote a simple program to duplicate the result and plotted it with gnuplot. For each probability p, I simulated one million wagers, and counted the number of times that I reached a new maximum.
Check out the graph:
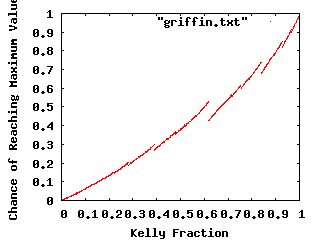
The discontinuities are real, and the discussion is quite illuminating.
Addendum: The discontinuities occur because of the following. Imagine that you are at an all time high, and then suffer a loss, then a win. When you lose, your bankroll is multiplied by 1-f, and when you win it is multiplied by 1+f. Taken together, you get 1 – f2, which is always less than one, so you know that after all possible sequences of length two that ends in a win (you need to minimally end with a win to reach a peak) you can’t reach a peak.
How about length three? Well, let’s try a loss followed by two wins. You have (1-f) (1+f)2, which you want to be one (or higher). Solving this, we get 1 + f – f2 – f3 = 1, which means f – f2-f3 = 0, or 1 – f – f2 = 0. Solving using the quadratic formula, we find that f yields a value of one precisely at (sqrt (5) – 1)/2, a number commonly referred to as the golden mean or phi. Sure enough, our graph displays a discontinuity there. At just below this value, a loss followed by two wins is insufficient to generate a new high, but at just over this value, it is. Since the probability of these particular sequences varies only infinitesmally, we see a strong discontunity in the chances of reaching a new high when f varies in this neighborhood.
Other possible sequences (two losses followed by three wins, for example) also generate similar but smaller discontinuities.
Very interesting.
At least to me.
But I’m a geek.
Addendum2: For fun, try reading Kelly’s Original Paper and figure out what it says about gambling.