Everyone I know in the twitterverse/blogosphere seems to be getting a cute little $50 piece of kit called the NanoVNA, which is a small vector network analyzer. In ham radio lingo, this means that it’s an antenna analyzer. IMSAI guy was the guy who first got me interested in getting one, and he did an awesome little video on one.
I ordered one for a little more than $50 off of eBay. Mine looks a teensy bit different, having a white case and sporting a stylish lizard on the front.
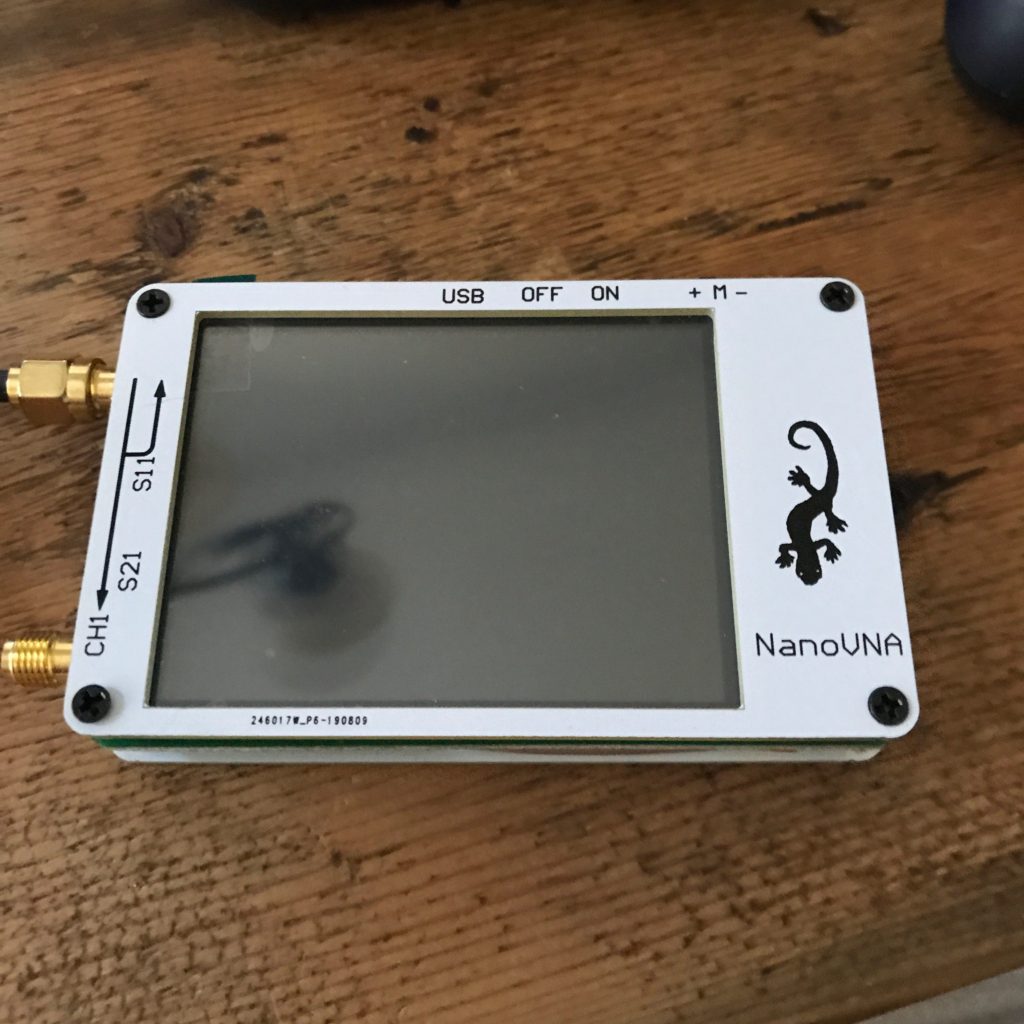
It came with a USB-C cable to allow it to be charged, a couple of short SMA cables, and a set of three small calibration dongles (one open, one short, one with 50 ohm resistance) so you could calibrate it. The battery was charged when it arrived, so I could power it on quite easily.
Here’s more or less what it looks like when powered on. I find the overall display to be a bit complicated by default. I need to work on figuring out how to set it up to a less cluttered display. As a ham, I’m usually most interested in using it as an antenna analyzer, which ideally means that I want to sweep it over a range of frequencies, and graph something like the standing wave ratio as it varies by frequency.
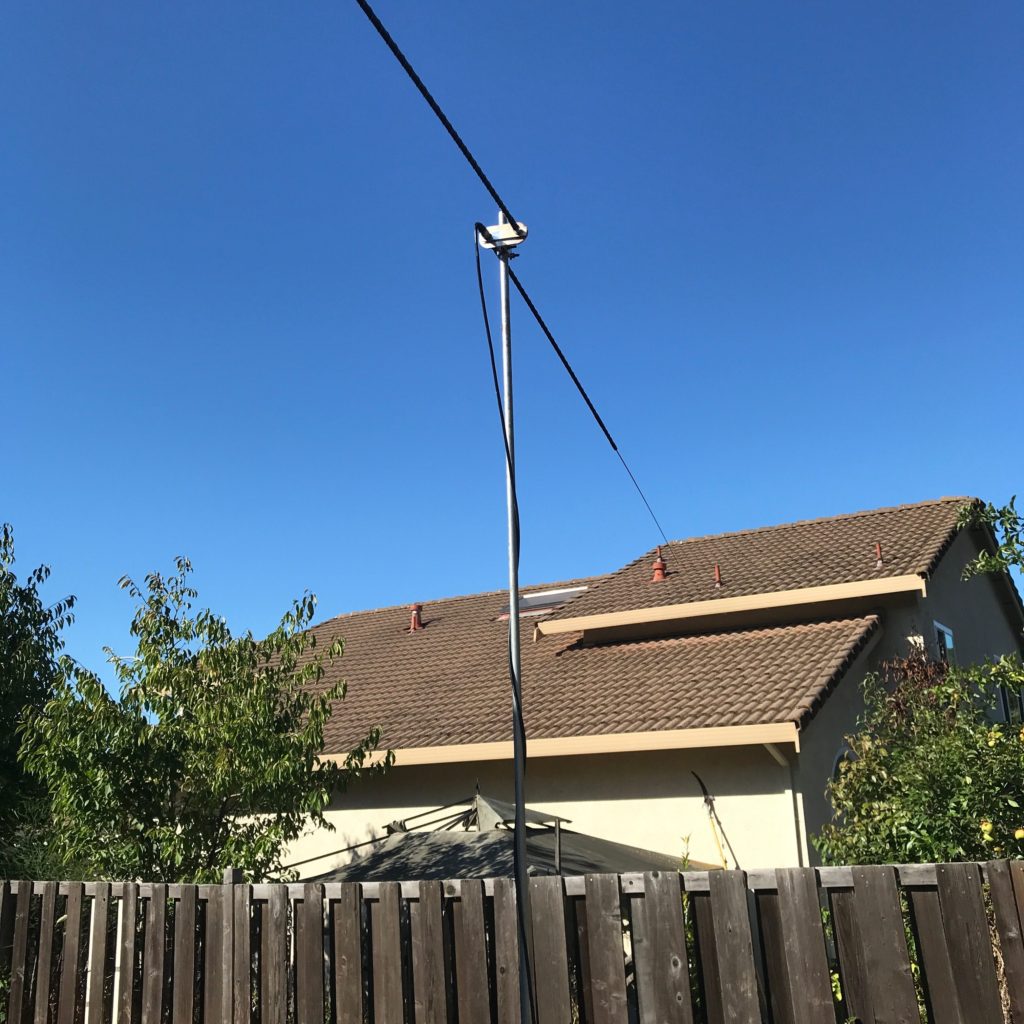
In fact, that’s exactly what I got it for. Long time followers of my blog might remember that I tried to setup a small WSPR beacon during the last Field Day, but that a variety of problems kept it from operating. Since then, I’ve actually replaced the burned out Arduino board and had it operating continuously from my back yard, powered by a small solar cell feeding a 7.2Ah lead acid battery through a Chinese charge controller. It consists of a (nominal, never accurately measured) 20mw signal feeding into this whip antenna dipole.
It’s way too low, and I didn’t do much to optimize it. I have an old MFJ-259 antenna analyzer which works fine and is built like a tank, but which is kind of annoying to use. It also doesn’t present any information graphically, and can’t sweep over a range of frequencies itself, so if you want to graph the performance of your antenna over an entire band, you need to basically get a pencil, fiddle the (analogue) frequency generator up and down, dutifully record the SWR (or whatever) over the frequencies, and then graph it yourself.
Yuck, who has time for that?
A friend of mine loaned me his Rig Expert AA600 which works well and will do frequency sweeps and graph the results, but it costs nearly $600, which is far too much for my hobby use.
That’s why I was interested in the NanoVNA. It seemed to be a good gadget that was available for hobbyist money.
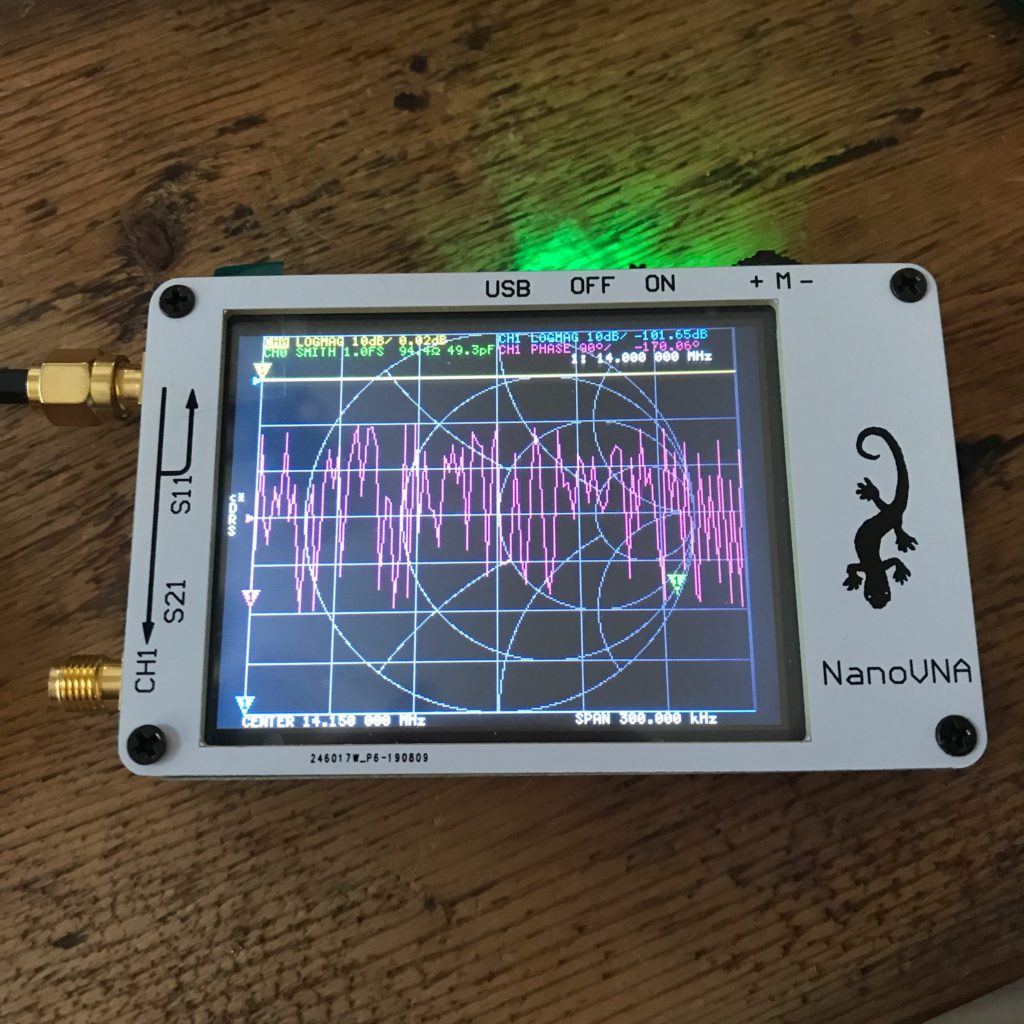
This morning I finally located the necessary pigtail that would allow me to connect the SMA connectors to the UHF connector on my antenna and got it hooked up. I am still a total novice at using it, but I managed to set the NanoVNA to scan the 20m band (from 14.0Mhz to 14.3Mhz) and graph the SWR. Here is the result (with lots of glare from the sun, but hopefully legible).
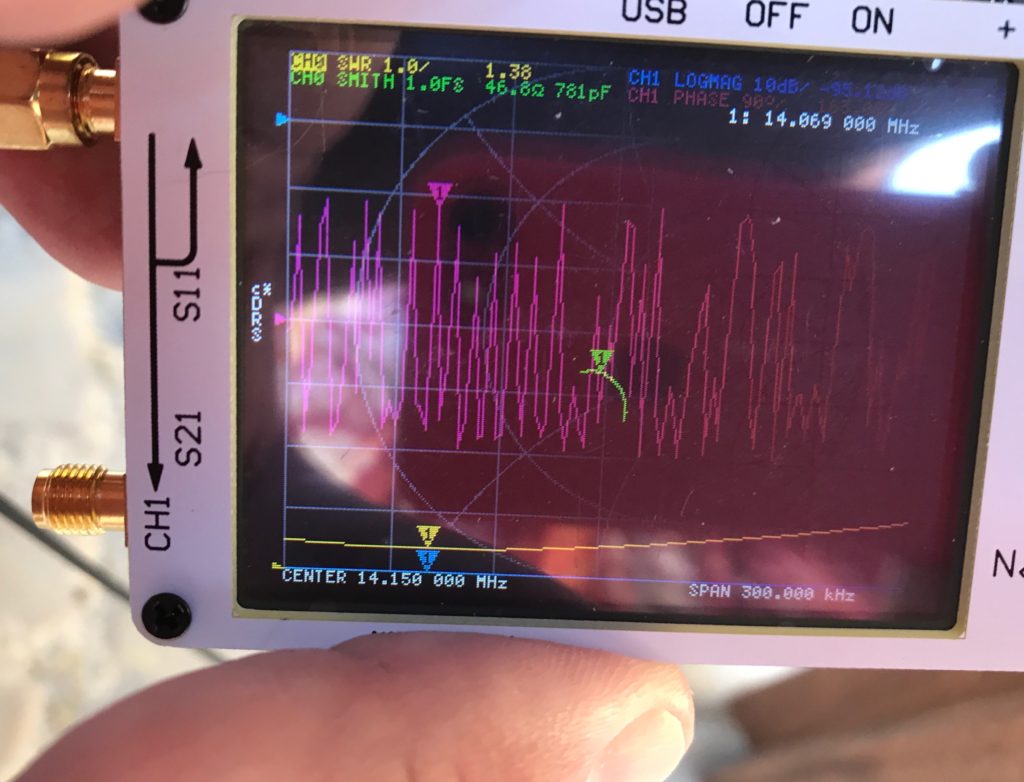
I haven’t decluttered the display, but you can look at a couple of things. First, near the upper right you can see in white that the frequency of interest has been set to 14.069, which is close to the frequency that I’m operating the beacon at. Going toward the bottom you can see that it says the center is at 14.150 MHz, and the span of the display is 300kHz. Just above it, you can see the tagged “1” inside a small triangle, which shows the current frequency, just above the curve in yellow. This is the SWR measurement. You can see that the lowest part of the curve is very near the “1” target. Nice! At the top of the screen in yellow, you can see that it shows the SWR as 1.38, which seems better than I expected.
Near the center of the screen, you can see the antenna impedance graphed on a smith chart. It is calibrated so the very center of the circular display would mean a purely resistive impedance of 50 ohms. The green line shows the complex impedance plotted over the frequency range. The green triangle marker shows the current frequency, which is very close to the center of the Smith chart. Nice! At the top you can read the complex impedance in green, which is 46.8 Ohms and 781 pF.
All in all, it’s a very cool gadget, and I think it will be a nice addition to my list of ham accessories.
A couple of small caveats:
- It has a nice color display that is touch sensitive, but it is on the small side, which makes it hard for a guy with large hands like myself to operate sometimes. It’s not insurmountable, and I’m sure it helps keep the cost down, but I do wish for more dedicated buttons.
- The ruggedness of the unit is, well, questionable. In particular, the small tilt switch at the top seems like it would not be great to have kicking around inside your “go bag” and is difficult to operate with gloves. These aren’t fatal for a device you use in the lab (although even there I do have an appreciation for more rugged devices) but you might need to be more careful in the field.
- The interface elements are a bit confusing, the fonts and color choices are not super legible, especially for someone with presbyopia like myself.
- The calibration accessories I received were not labelled, and it took me a few minutes to figure out which was which.
- I haven’t yet explored controlling the NanoVNA from a PC, which might allow for a better user experience.
It does appear that the firmware for the device is open source which means that some of the rough edges that I see might be fixed over time, and may in fact mean that I could write my own firmware that would be more tailored to my own use cases, which is awesome.
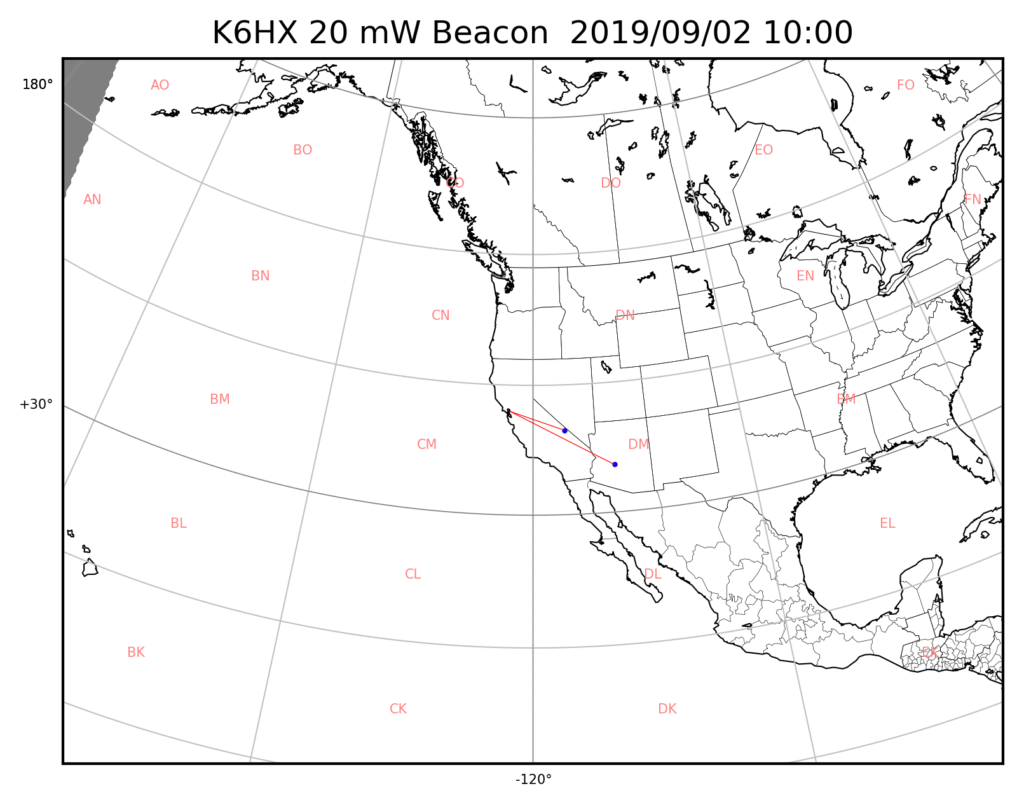
Addendum: if you want to see where my beacon has been seen on the WSPR network, you can search for K6HX on the wsprnet.org website, or visit my own custom website which updates every fifteen minutes, and shows all the spots from the previous 24h. I do occasionally get spots from as far away as Hawaii and the East Coast, but today seems a bit more sedate.