I recall burning three or four weeks of a sabbatical getting Saccade.com on the air with Wordpress. So much tweaking…
Somewhere… over the (simulated) rainbow revisited…
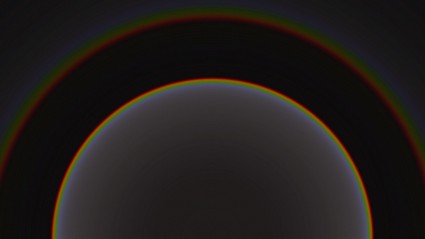
A couple of months ago, I did some simple simulations of light refracting through raindrops in a hope to understand the details of precisely how rainbows form. The graphs I produced were kind of boring, but they did illustrate a few interesting features of rainbows: namely, the double rainbow, and the formation of Alexander’s band, the region of relatively dark sky between the two arcs.
But the pictures were kind of boring.
So, today I finally got the simulation working, did a trivial monte carlo simulation tossing fifty million rays or so, and then generated a picture by converting the spectral colors to sRGB. Et voila!
Horribly inefficient really, but satisfying result.
Addendum: In comparing the results to actual photographs of double rainbows, it seems like my pictures are scaled somewhat strangely (the distance between the arcs seems large compared to the radius). I suspect this is mostly due to the linear projection that I used and the very wide field (the field of view of the camera is nearly 100 degrees, which compresses the center and expands the outside. I’ll have to make some narrower field pictures tomorrow when my mind can handle the math, I’ve reached my limit tonight.
Comments
Comment from Anonymous
Time 11/6/2010 at 10:14 pm
But really, this is cool
Comment from Miguel
Time 3/13/2013 at 2:20 pm
Is that a gaussian blur ?

Comment from Anonymous
Time 11/6/2010 at 10:13 pm
It’s a double rainbow all the way
What does this mean? It’s so bright, so vivid
Double rainbow, double rainbow, it’s so intense (tense)
What does this mean? It’s startin’ to even look like a triple rainbow
That’s a whole rainbow, ahahahah!
Double rainbow all the way ‘cross the sky… yeah yeah